Traffic Deaths In 2019 Down While Speeds Are Up: Why?
For the third year in a row traffic deaths went down. This in spite of speeds and road usage both increasing in 2019. Deaths were down 1.2% to 36,120 people. In 2018 that number was 36,560 according to the National Highway Traffic Safety Administration. Highway travel increased by almost one percent to 3.23 trillion miles. Looking at it another way; the fatality rate per 100 million miles was 1.10. That figure was down from 2018’s 1.13 per million miles traveled.
While traffic deaths have decreased, pedestrian deaths continue to climb
While traffic deaths on the streets and highways have decreased, pedestrian deaths continue to climb. In 2018 there were 6,283 pedestrians killed which were the highest amount of deaths since 1990. The number climbed 3.4% from 2017.
Some are pointing the finger at distracted drivers using their phones. The NHTSA has not attributed a cause. For 2019 pedestrian deaths have fallen 2% from 2018 while bicyclist deaths fell 3%.
What the NHTSA will be looking at for this year are the numbers once the pandemic lockdowns are lifted. Since many have been home for months will this lapse in highway driving have an effect on accidents? Will those use to empty highways suddenly be more prone to an accident with so many more cars?
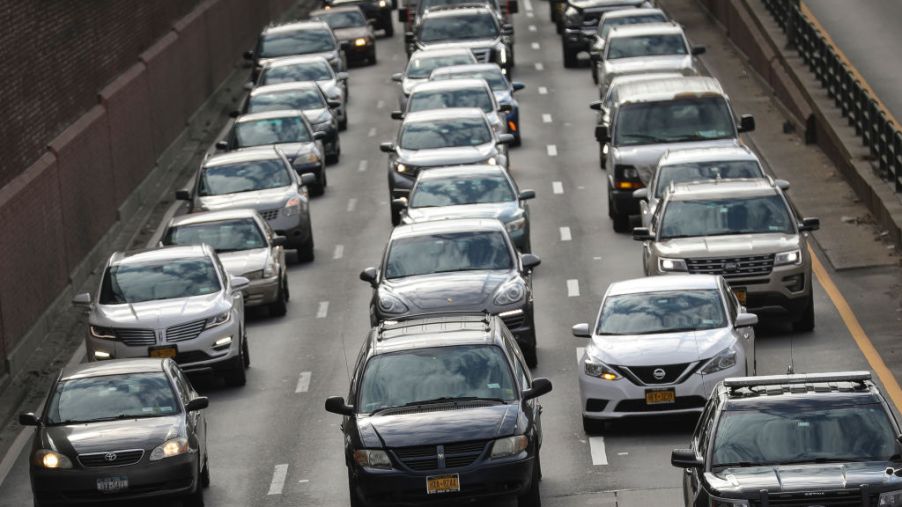
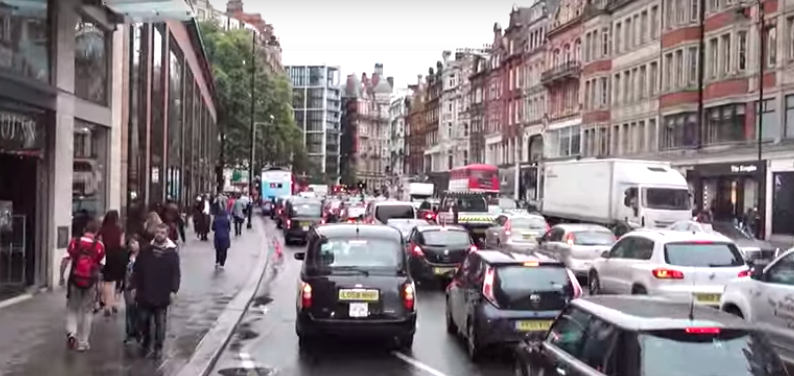
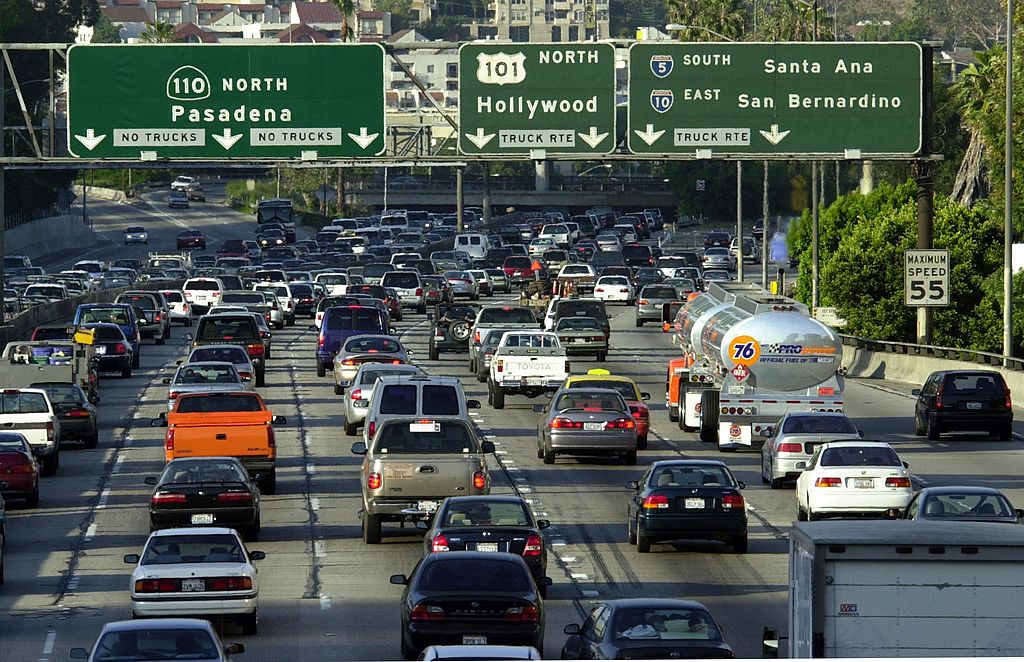
With streets and highways empty data shows speeding has increased significantly
With streets and highways being empty for the first part of 2020 data shows that speeding has increased significantly. Once the travel bans are lifted how will drivers used to going faster than the posted speed limits adjust? Will they be compelled to attain similar speeds to those they drove back in 2019?
The NHTSA plans on releasing public awareness campaigns once the stay-at-home orders are lifted. It will release the information first in states lifting the orders first. The campaigns will focus on driving safely after the pandemic. “When you get back on the road now is the time to remember all the safe driving practices that you had,” says NHTSA Administrator James Owens. “We’ve continued focusing on the behaviors that we know are unsafe; failing to wear a seat belt, speeding, driving while impaired, and driving while distracted.”
There were 51,091 people killed in traffic accidents in 1980
As a comparison, 51,091 people were killed in highway traffic accidents in 1980. That figure dropped by 10,000 people by 2007. So overall the numbers continue to fall.
Drivers ultimately choose a speed they are most comfortable and feel safest with, so with fewer vehicles, they feel safer going faster. Also, vehicles have evolved to the point that they are safer, can go faster, brake and handle better, and are quieter. All of these factor into speeds rising.
Speeds are also increasing because they’re allowed to based on higher posted speed limits. In states like Minnesota and Maine, traffic data shows increased speeds. When that data is used to determine posted speed limits planners go with what 85% of drivers are doing. By using that standard assessment posted speeds are increased matching what is called the 85th percentile.
With posted speed limits increased overall yearly speeds are increasing
The 85th percentile is determined to be the speed at which 85% of drivers feel most safe and comfortable driving. So with posted speed limits increased it stands to reason overall yearly speeds are increasing.
But the NHTSA is quick to warn that increased speeds also increase the chances of a fatal accident.