
Top 10 States With the Worst Drivers

Ah, one of Americans’ favorite hobbies, telling people from other states they have the worst drivers. Whether it’s because you commute to another state or just have a hunch, everyone has their own idea of which state has the worst drivers. Data scientists at Insurify took a deep dive into what makes a driver bad, and where those people are mostly located.
What makes someone a bad driver?
There are plenty of ways someone can be defined as a bad driver. For most people, it’s because they cut you off or didn’t yield when they should have. The metrics used to determine bad driving by Insurify, however, are more concrete and provable.
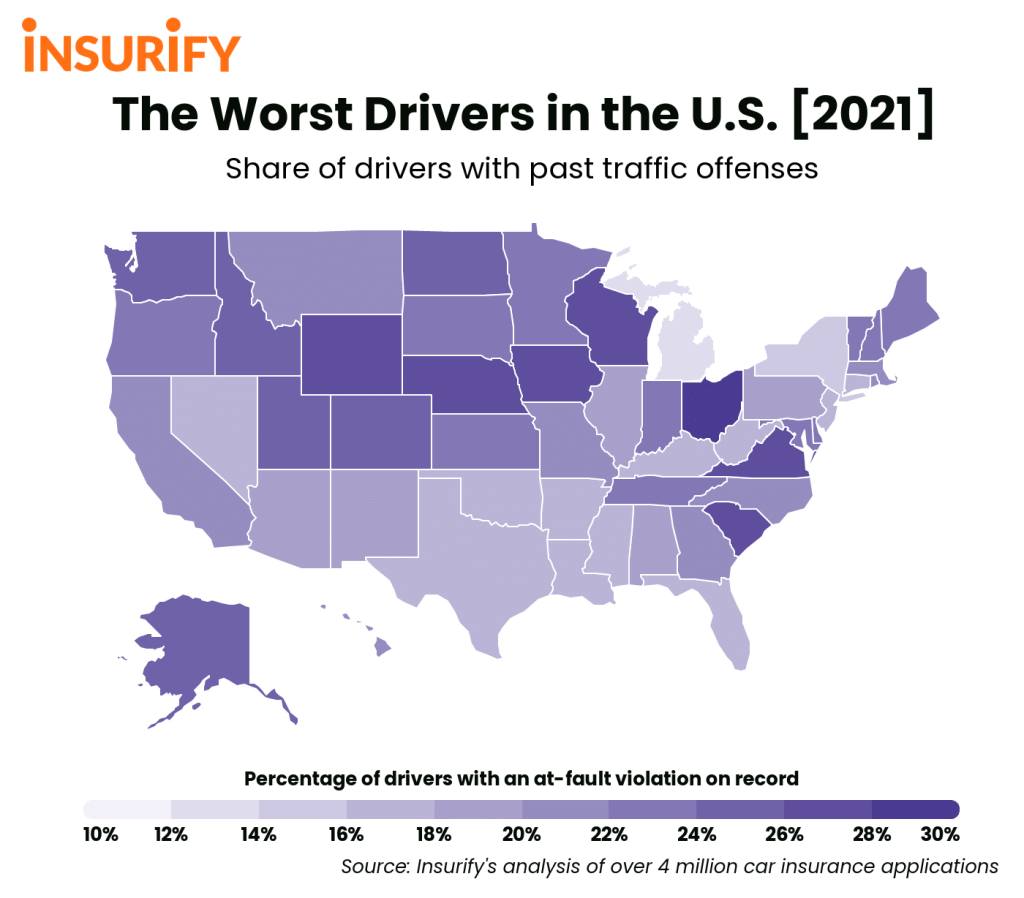
Firstly, the number of drives with an at-fault violation on their record. This means they’ve been in an incident where it was considered their fault, and that is displayed on the driver’s current driving record. This includes people who have been involved in accidents, DUIs, failures to stop, speeding, reckless driving, passing violations, and other citations for illegal driving. Insurify then compared these numbers from each state to the total number of drivers applying for car insurance.
National Averages
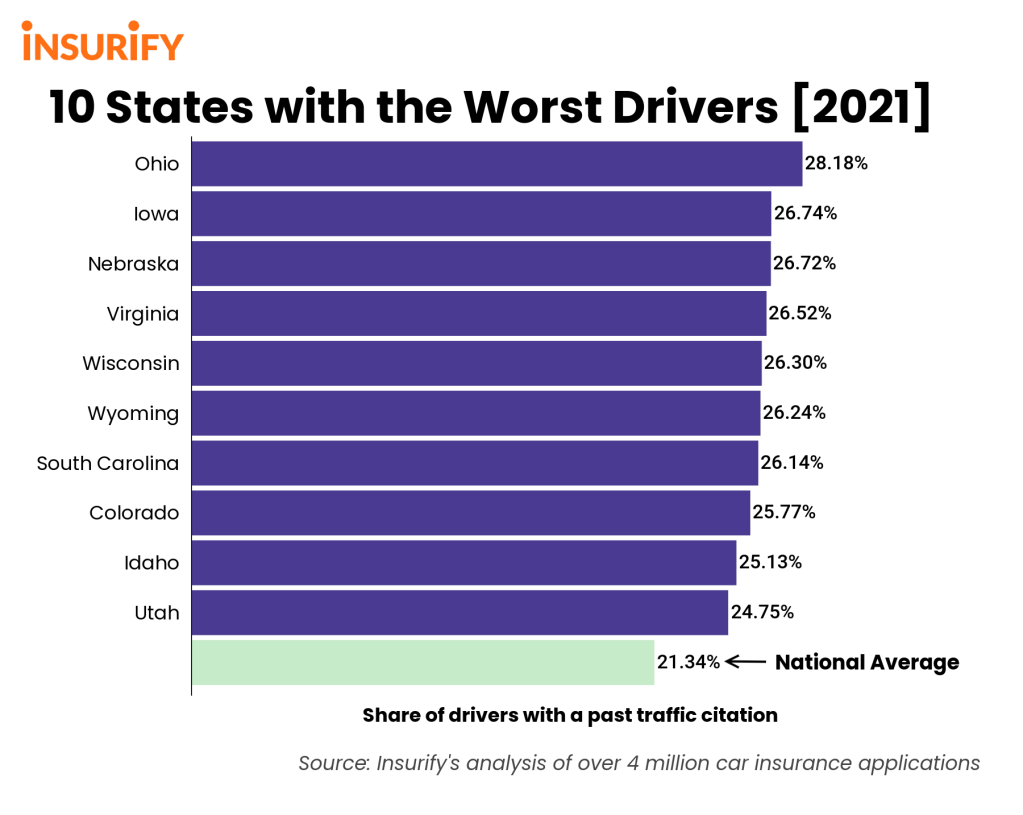
According to Insurify, the average share of drivers reporting a prior traffic incident is 21.34 percent. In 2019, the average number of traffic fatalities per 100,000 population in the U.S. was 11. Therefore, if any of the states are exceeding that national average regularly, they’ll likely be considered a state with bad drivers.
10. Utah
- Share of drivers reporting a prior incident: 24.75%
- Traffic fatalities per 100,000 population: 7.7 deaths
Though tenth isn’t quite enough for someone to say Utah has the worst drivers in the country, there are 40 other states that can say Utah is worse than them. Utahn drivers are cited for illegal behavior while driving 14 percent more than the national average.
9. Idaho
- Share of drivers reporting a prior incident: 25.13%
- Traffic fatalities per 100,000 population: 12.5 deaths
The incident rate for Idaho has actually decreased from 27.7 to 25.13 since 2019, but it’s still enough ahead of the national average to land Idaho drivers ninth place on the worst drivers list. Not to mention they’ve averaged 4.8 more deaths per 100,000 people than tenth place Utah.
8. Colorado
- Share of drivers reporting a prior incident: 25.77%
- Traffic fatalities per 100,000 population: 10.3 deaths
While Idaho tends to have more fatal incidents than Colorado, Colorado’s overall number of incidents remains higher. Could dangerous driving have any correlation with the high altitude?
7. South Carolina
- Share of drivers reporting a prior incident: 26.14%
- Traffic fatalities per 100,000 population: 19.4 deaths
With a number of incidents coming in just above the previously mentioned Colorado, we can’t say the same for fatalities. South Carolina nearly doubles Colorado’s traffic fatalities per 100,000 people. South Carolina actually ranks fourth in the country for traffic-related deaths per capita, according to Insurify.
6. Wyoming
- Share of drivers reporting a prior incident: 26.24%
- Traffic fatalities per 100,000 population: 25.4 deaths
Reported driving incidents continue to slowly climb up as the list continues, while fatalities continue to take leaps. Wyoming drivers have the second-highest DUI rate in the country, which surely results in a high number of fatalities. Wyoming’s traffic fatalities per 100,000 population are the highest in the country, at 57 percent higher than the national average.
5. Wisconsin
- Share of drivers reporting a prior incident: 26.30%
- Traffic fatalities per 100,000 population: 9.7 deaths
Wyoming has been known to appear on the top ten rankings for DUIs and rudest drivers in 2021. Which inevitably leads to their large number of reported incidents. Though Wisconsin averages more total incidents than Wyoming, they average just a fraction of the fatalities per 100,000 people.
4. Virginia
- Share of drivers reporting a prior incident: 26.52%
- Traffic fatalities per 100,000 population: 9.7 deaths
Virginia ranked first as having the rudest drivers in the country for 2021 according to Insurify, so it’s no surprise they land this high on the list. A whopping 20-percent higher than the national average overall driving incident rate, fatalities being lower than the national average help keep Virginia from ranking even higher.
3. Nebraska
- Share of drivers reporting a prior incident: 26.72%
- Traffic fatalities per 100,000 population: 12.8 deaths
While the prior incident reporting continues its upward trend with our list, the traffic fatalities had actually declined quite a bit from national leader Wyoming. That number jumps back above the national average with Nebraska. Insurify says its data suggest Nebraskan drivers are on the negligent side, resulting in these high numbers.
2. Iowa
- Share of drivers reporting a prior incident: 26.74%
- Traffic fatalities per 100,000 population: 10.6 deaths
Iowa drops back below the national average for traffic fatalities per 100,000 population with just 10.6 but has even more incidents. Only 0.02% more incidents than Nebraska, drivers in Iowa get themselves citations 21 percent more frequently than the national average.
1. Ohio
- Share of drivers reporting a prior incident: 28.18%
- Traffic fatalities per 100,000 population: 9.9 deaths
If you made it all the way to the end of this list, you were probably expecting to see your home state or maybe a neighboring one. If either of those is Ohio, you’d be right. This is it, the worst drivers in the country are from the Buckeye State. Topping out the list with the highest reported prior incidents, Ohioans may need to let off the gas pedal a bit. They are number one on a few lists other than this one, including most speeding tickets per capita, and overall citations received. Though Ohio comes in just below the national average for traffic fatalities, their dangerous driving habits landed them the top spot on the list for states with the worst drivers in America.
If you saw your home state on this list, you might be thinking “I was right!”. If you didn’t see your home state or any surrounding states on this list, maybe you’ll rethink your route the next time you take a cross-country road trip.