Public Transportation Is the Worst in These 10 Cities
Many cities have public transit to help their residents get around town. Public transportation allows the public to pay a fee to access a system with a schedule, established routes, and a way to move a large number of people at once. It can help reduce the burden of traffic as well. But not all cities have great public transportation. Someone’s got to be at the bottom of the list, though. Is your city one of them?
Some Facts About Public Transportation
There are many options for public transportation, although not all are in every city. Here are a few ways to get around:
- Buses
- Subways
- Monorail
- Ferries
- Commuter trains
- Cable cars
Did you know that there are about 6,800 organizations that provide the US public transportation? And by investing in public transit, communities can reduce the nation’s carbon emissions by 37 million metric tons each year. But not all cities do this well. Let’s look at the ones that struggle the most.
The 10 Worst Cities for Public Transportation
WalletHub published a report this month to show which cities had the best and worst public transportation. They looked at several factors with specific elements in each area they were grading. Here is the breakdown:
- Accessibility and Convenience looked at the number of commuters using public transit, their average commute time, car vs. public commute time, the availability, jobs within a 30-minute commute, peak hours, costs, the number that choose public transportation over their vehicle, whether the city has rapid bus or rail transport, and airport accessibility.
- Safety & Reliability measured the number of safety events, injuries, and fatalities per miles traveled.
- Resources were weighted less than the other two factors and analyzed things like the mileage traveled, the number of transit vehicles in service, and the age and lifetime miles of each transit vehicle in use.
They based the ranking on a 100 point system. Here are the winners – well, losers – in order of near the bottom of the list to the very bottom of the list.
10. St. Louis, MO
St. Louis came in at number 91/100 on WalletHub’s list with an overall score of 46.51%. The city came in 17th for accessibility and convenience but hit quite the snag when it came to safety, ranking 96th overall out of 100 for safety and reliability. It was just the middle of the road at 51st place for resources.
9. Baton Rouge, LA
This city bombed in the first two categories by earning 91st place on both. Unfortunately, the 17th place they received for resources wasn’t enough to bring up their overall score of 46.26%.
8. Arlington, TX
Here’s another case of respectable scores when it comes to the resources score, which was 20th place (96th and 79th were the other scores, respectively). This put Arlington at a total score of only 45.70%, making it the 8th worst city for public transportation.
7. Oklahoma City, OK
Scoring 94th overall, OKC earned 45.64%. Their main positive area falls in the accessibility and convenience category, where they only scored 55th out of 100. But in 90th and 89th places, the other two categories failed to get a higher ranking.
6. Tulsa, OK
Another Oklahoma city also scored low on the list with 43.02% overall. They needed improvement in the first two areas (72nd and 94th places respectively) and were just ahead of the curve at 48th place out of 100 for resources.
5. New Orleans, LA
New Orleans was the city earning last place in the resources category, so it could use some help. It did score 92nd in safety which also isn’t something to brag about. Unfortunately, their one positive of earning 28th out of 100 in the area of accessibility wasn’t enough to help, and they scored only 42.43% overall.
4. Charlotte, NC
Charlotte is another city that needs improvement, with a score of 40.67%. All areas were in the bottom half, with a ranking of 53rd in accessibility, 95th in safety, and 88th in resources. Not good, Charlotte, not good.
3. Tampa, FL
This city looks like it needs to talk to the top 10 on the list with its rankings of 73rd, 98th, and 91st respectively, which put Tampa towards the bottom of the list. The overall score it earned was a lowly 24.69%. Pretty bad, especially when you consider the considerable drop from the 40s to the 20s for overall ratings.
2. St. Petersburg, FL
With all scores above 70th place, this city could use some improvement. Ranking 73rd, 98th, and 91st place respectively, it only earned a score of 24.03%. Ouch, St. Petersburg!
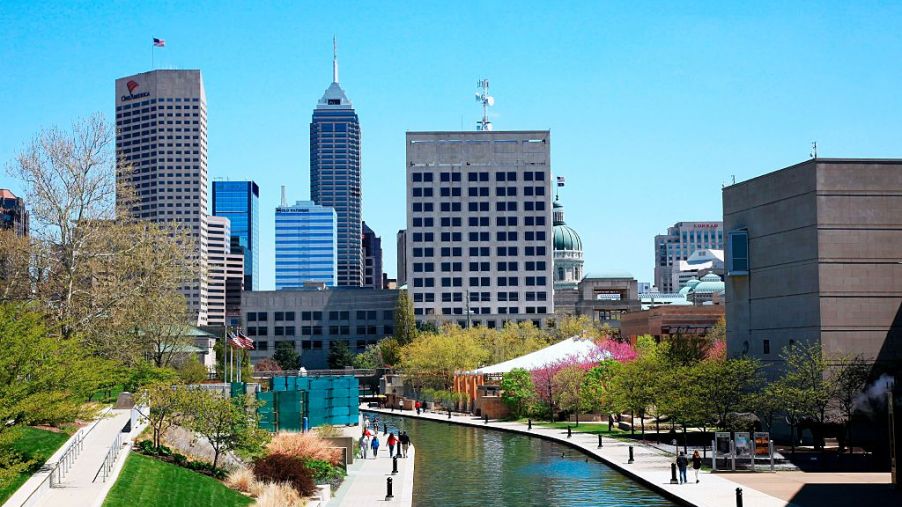
1. Indianapolis, IN
With the lowest score of all 100 cities for public transportation at just 21.13%, this city did not fare well. It was the worst overall for safety and reliability and ranked 87th place for accessibility. It did manage to rank 39th for resources, but they still landed at the bottom.
Will You Drive or Take Public Transportation?
Let’s face it, commuting sucks. Driving can be fun, but having to sit through hours of traffic to get to work is no one’s idea of a good time. And these cities aren’t making it any easier. It looks like they may have a bit of work to do to catch up to the cities higher up on the list. If you live in one of these cities, you might want to consider driving yourself to your destination or moving to a different city.


