Here Are the 10 Worst States in the U.S. You Can Drive In
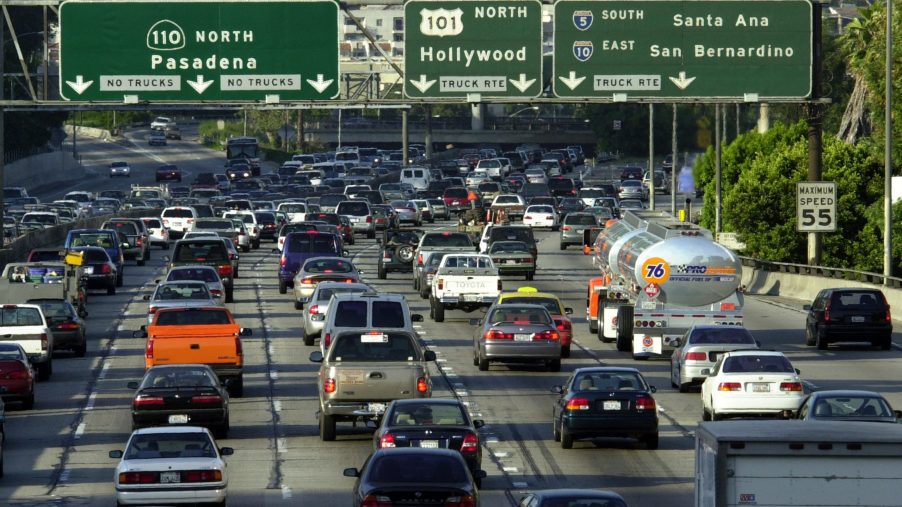
Aside from baseball, it seems as though driving is America’s favorite past time, especially during a global pandemic. However, according to the Office of Highway Policy Information, the cumulative amount of travel as of October 2020 was down 380 billion vehicle miles nationwide, which is a 13.9-percent decrease over 2019. But despite the fact that nationwide traffic has decreased, Americans still want to know that they’re driving on safe roads. As such, WalletHub put together a handy list of the best and worst states in America that you can drive in. Here are the 10 worst.
The 10 worst states in the U.S. to drive in
While you have probably pointed the finger at certain states and proclaimed that they have the “worst drivers,” here is some evidence to back up your claims and frustrations. However, the list below doesn’t call out the states with bad drivers or the worst traffic congestion, there’s actually a lot more that went into it.
When taking all of the states into consideration, WalletHub compared them using four different categories, which included:
- Cost of ownership and maintenance
- Traffic and infrastructure
- Safety
- Access to vehicles and maintenance
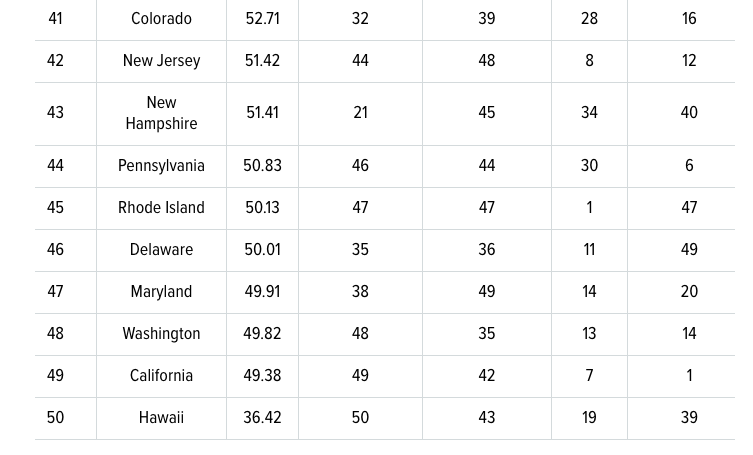
Ultimately, WalletHub gathered up all of the data and ranked all 50 states. Here are the bottom 10 states on that list:
- Colorado
- New Jersey
- New Hampshire
- Pennsylvania
- Rhode Island
- Delaware
- Maryland
- Washington
- California
- Hawaii
How were the categories weighted?
Each of the four categories that were taken into account included different metrics for each one. WalletHub assigned a point value to each metric on a 100-point scale, with a 100 score being the best for drivers. The metrics for each category were as follows:
Cost of ownership and maintenance (30 points)
- Average gas prices
- Average annual car insurance premium
- Maintenance costs
- Total extra vehicle operating costs per driver
Traffic and infrastructure ( 30 points)
- Share of rush-hour congestion
- Increase in vehicle traffic on highways (2018 vs 2020)
- Number of days with precipitation
- Number of icy days
- Number of strong wind and hail storm reports
- Average commute time by car
- Road quality
- Bridge quality
- Roadway miles per 1,000 people
Safety (30 points)
- Traffic indiscipline (traffic incidents due to phone usage, speeding, aggressive acceleration, harsh braking, and poor turning)
- Share of adults who always, or mostly, wear seatbelts
- Traffic fatality rate
- Change in traffic fatality rate (2018 vs 2020)
- Car theft rate
- Larceny rate
- The strictness of DUI punishment
- The strictness of high-risk driving
- Driving laws
- Share of undisclosed drivers
- Likelihood of collision with animals
- Animal loss claims per total number of drivers
Access to vehicles and maintenance (10 points)
- Car dealerships per capita
- Auto repair shops per capita
- Car washes per capita
- Gas stations per capita
- Alternative fuel stations per capita
- Parking lots and garages per capita
They were all averaged out
After compiling all of the data for each state, WalletHub then determined each state’s average across all of the metrics to calculate the score for each state and then ranked them accordingly. For an easier look at what it all equated to, here is the table that WalletHub put together:

As we can see, determining the best and worst states to drive in is not as cut-and-dry as you would think. This means that while it’s easy to point fingers at every state and say that it is “the worst” one to drive in and has the “worst drivers,” there’s a lot more to factor in. And, in case you’re wondering, Texas came out on top overall.